Tapping The Untapped: Data Visualization with Tableau
Why You Need To Move On!

The inefficient and sluggish “Report Factory” models, that many organizations have been relying upon till now to seek answers for daily challenges, are now things of the past. Mainly because while using such you have to rely on your IT team(s) to provide the final solution, which consists of these three steps:
- Producing a Report
- Reviewing the Report
- Coming to a Conclusion
Finally hope the data is still relevant, given their redundancy due to lack of real-time data capturing and analysis.
Filled with dull, inactive, and complex tables, bar charts, Waterfall chart, Radar chart, and bar charts, such reports barely give present you with insights if you are not ‘that’ good with numbers and stats. Thus again making the so-called “tech-guys”, to decode and deliver the insights to you, the one who needs to make a decision; hence seizing a direct line between insights and you.
And that’s the problem that this modern BI (business intelligence) tool, Tableau, has chosen to address and solve. By delivering the power of data collection, transformation, and analysis directly in your hands, Tableau Consulting Services helps your company, or department, in making decisions backed by accurate data, rather than the insights analyzed and delivered by a third party.
What is Tableau?

Tableau is an interactive and easy-to-use data BI(Business Intelligence) tool that enables you to create interactive and apt visualizations, in form of :
- Dashboards
- Worksheets
- Stories
Gain business insights for the better development of your company, even when you have little to no knowledge of coding or programming.

Key Features of Tableau

Since the very launch, Tableau products have become famous among data analysts, managers, and data scientists alike. Tableau Consultant is transforming the way people use data to solve the problems. It makes analyzing data fast, easy, beautiful, and useful, gaining goodwill even among those groups who were not interested in using BI tools in their daily operations. Here are some benefits that will make you love Tableau too.
1. Security permissions at any level
In Tableau, you set ‘content permissions’ to specify who is allowed to work with which contains resources on a particular site. That is, you can decide who can see your company’s, or department’s, cash flow, but widely share organizational content with as many employees you want.
2. Dashboard commenting
With Tableau and Tableau Consulting, you can add comments about data discoveries, or work progress, with other Tableau Server or Tableau Online users. Any comments you add in a desktop browser also appear in Tableau Mobile, and vice versa, so you can easily communicate with colleagues on the go.
3. Create “no-code” data queries
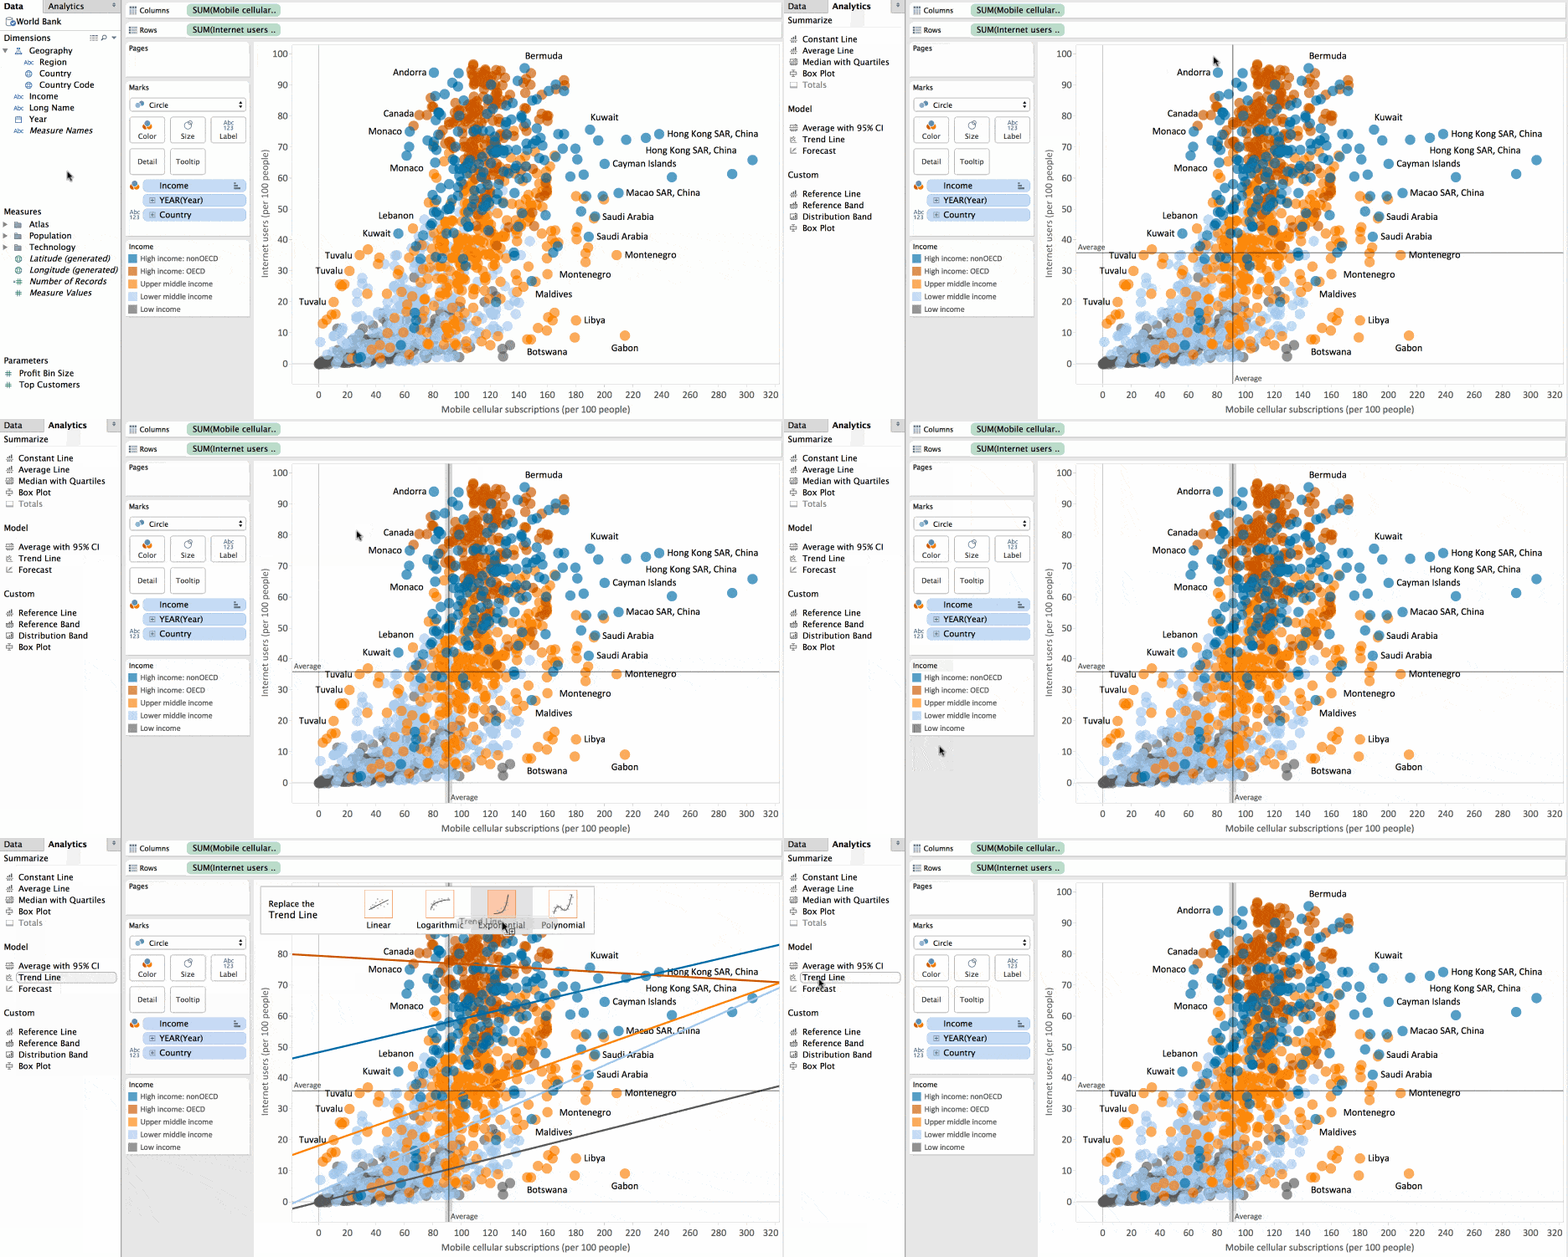
This one comes as a boon for strictly “non-tech” guys. It is possible to query data sources without performing a single line of code query in Tableau.
4. Customized notifications Alerts
If you are too concerned about your sales figure ‘dipping’ below about a certain mark, then you can set the custom notification in Tableau. For e.g, as soon as your profits go down then a set limit, or your expenses go up then a certain mark, you will automatically get an alert via e-mail.
5. Tableau Mobile
You can enjoy all the real-time dashboard awesomeness on your mobile, or tablets, with Tableau mobile.
6. Subscribe your peers
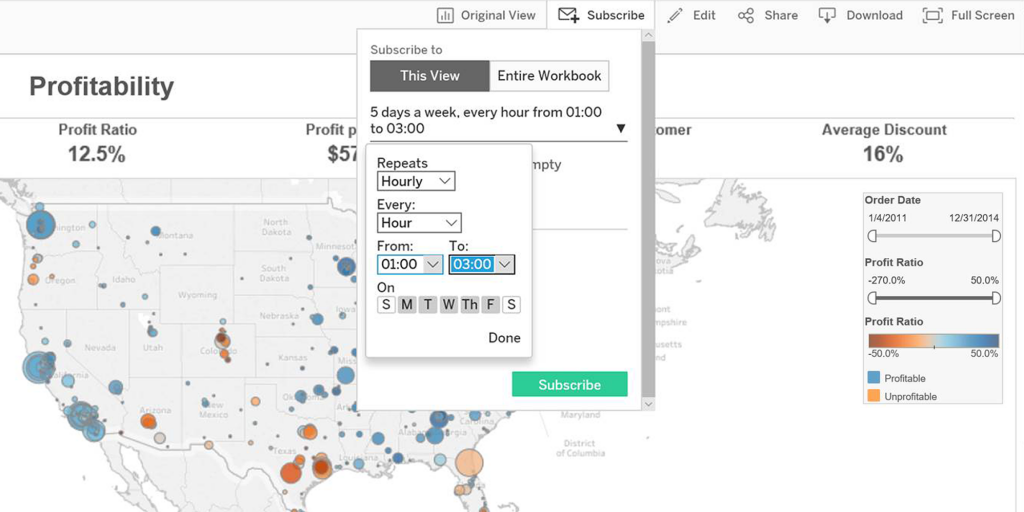
You can send subscription emails to others, or allow others to subscribe to our dashboards just through a click with Tableau.
Benefits Of Tableau

With Tableau on your desktop or mobile, you attain the power of business intelligence, which grows your company, or your department, rapidly and makes it easy-to-comprehend by consumers and clients. So, when you decide to come on board with Tableau Consulting Services, you would be enjoying hundreds of benefits. But to name a few:
1. Best There Is
Tableau’s technology is patented from Stanford, America. So you could rest assured that your data, and the visualizations that you create with it, are world-class, and secure as well. And if that’s not all, then you would be delighted to know that Tableau Consulting Services has made it to Gartner’s Magic Quadrant when it comes to visualization techniques and tools.
2. Easy-to-create interactive visualizations
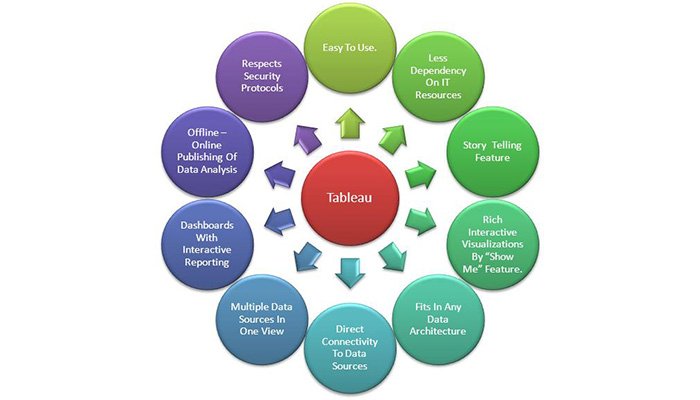
There is a big reason why Tableau is always hailed as an easy-to-work-with BI tool. Not only its drag-and-drop functionality makes it easier to create an interactive dashboard, but its technology also limits you from creating charts that are against data visualization best practices by tableau consulting services.
3. Large data, without Lag
Tableau can handle millions of rows of data with ease, without slowing down. This stand-out feature is what makes Tableau Consulting Services gain an edge over other BI tools.
4. Easy to use with other languages.
Though you don’t need to know any coding when using basic Tableau functionalities, still if a need arises to use languages like Python or R, for avoiding performance issues and to do complex table calculations, Tableau Consulting Services can be easily integrated with such languages for the above-mentioned process.

