
Pictures to Profit: Data Visualization in Retail
Though the conventional physical retail stores have suffered a huge loss of business at the hands of e-commerce giants like Amazon and Flipkart, there are still many which continue to grow strong even after.
While challenges, such as:
- Digital Disruption
- In-store Experience
- Employee-to-customer Ratio
- Competitive Pricing
- Marketing & Advertising
Continue to chew down the profits of many retailers, retail store brands, such as ‘Walmart’ and ‘Target’, have managed to stay strong; or even better, grown beautifully. But what made such stores grow successfully in time when e-commerce proved to be a cause for triple-digit close down of some major retail brands like Sears, Blockbuster, The Gap, etc., 2012 alone (source) ?
The answer is “An efficient and mass application of data solutions”, especially, Data Visualization, to their daily business activities, which simplifies every aspect of business process.
Visualizing Solutions: Data Visualization in Retail Store Management

Retail consumers today want the ‘celebrity’ treatment when they engage with retail store(s), as they expect store managers to:
- Anticipate their needs
- Have the products they want on-hand
- Adapt to their needs as they change
But given the number of customers, or even window shoppers, it is near to impossible for retailers to individually asses and cater to the needs of every single shopper. That’s why retailers have long been relying on market based research to figure out which groups or products customers are more likely to purchase together. It’s a well-understood business processes, and now it can be brought directly to you in more intuitive and simple manner with Data Visualization.
No matter what your sources for data collection have been till now to understand customer behavior, with help of modern BI(Business Intelligence) tools (like Tableau, Power BI , Google Data Studio), now it’s easier than ever to get all that behavior in form of structured data that helps you gain insights.

Be it:
- Your store’s website, or social media pages
- Marketing campaign by a market researcher
- POS system
- Promotional calendars
All such sources can be integrated with custom made data visualization solutions, namely,
- Finance Dashboard
- Sales Dashboard
- Marketing Dashboard
It help you collect, transform, and analyze big data that will prove to be critical for you when taking decisions, which will result in providing a rocket-growth to your store’s sales figures.
Solutions That Deliver: BI in Stores
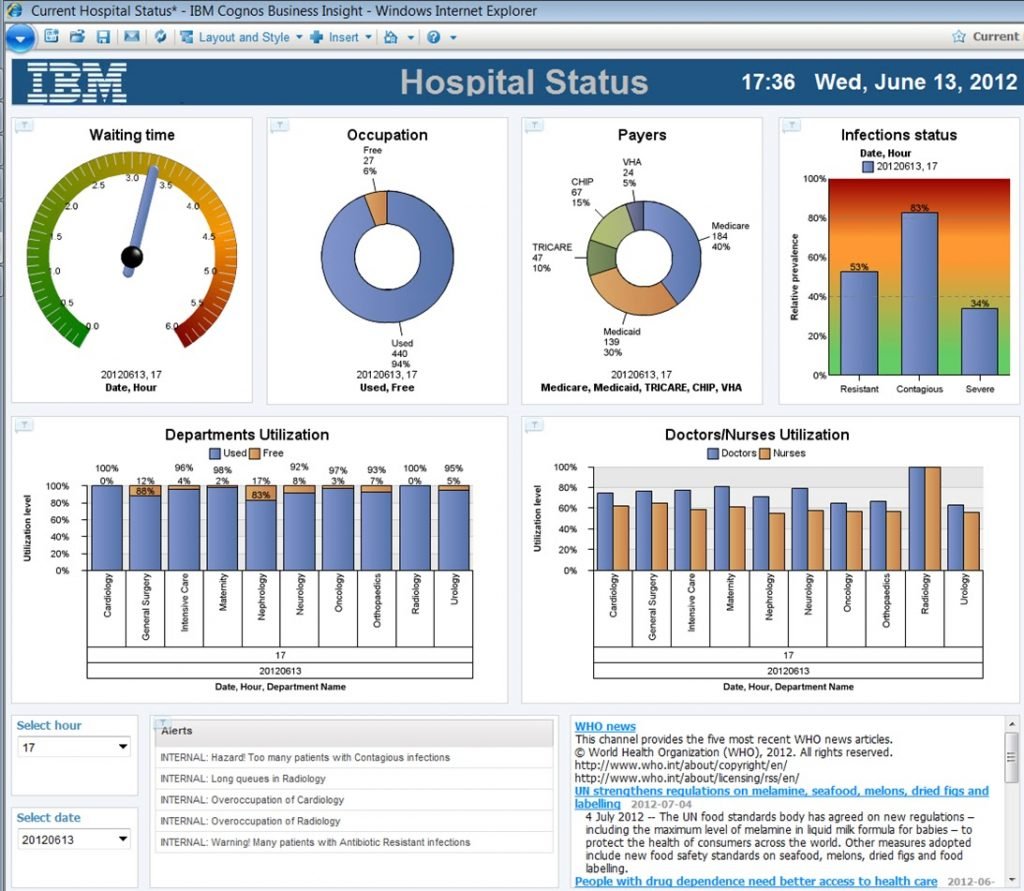
Business Intelligence, or (BI), is a set of techniques and tools employed for the acquisition and transformation of raw data into meaningful and useful information for business analysis.
And with modern BI tools like Power BI , Tableau, Google Data Studio, etc., it’s now easier than ever to collect, transform, and analyze big data that is produced by your store(s).
The key solutions that these BI tools provide when it comes to data visualization are:
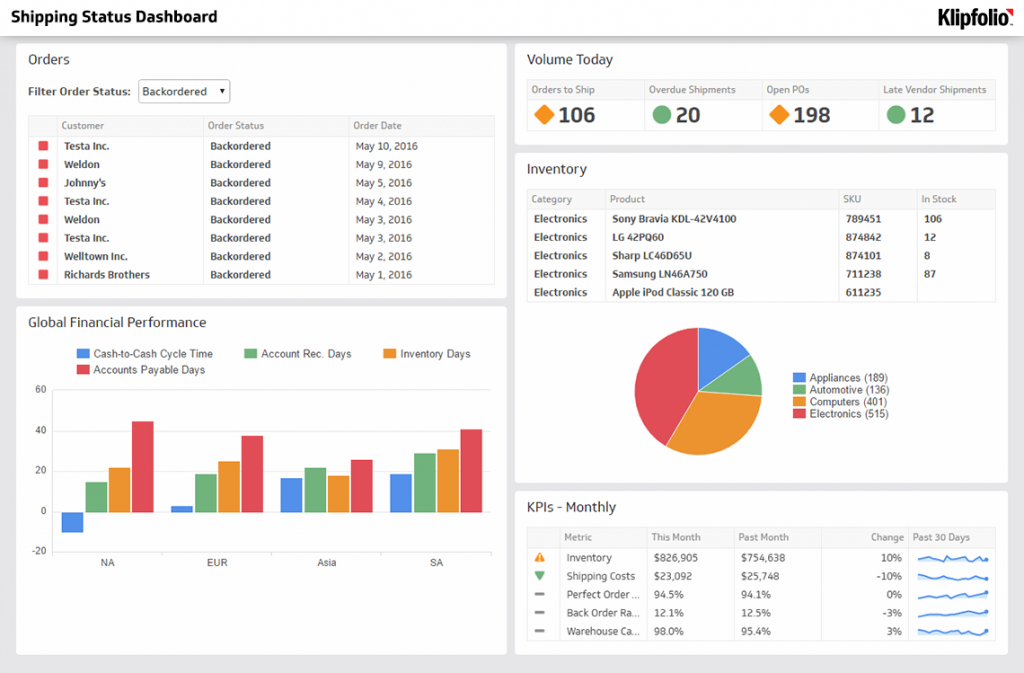
KPI dashboard
A KPI (Key Performance Indicator) dashboard lets you measure how effectively your store is achieving key business objectives. It helps you evaluate, judge, and monitor your store’s performance based upon performance indicators, like:
- Retail Conversion Rate
- Average Sale
- Sales & Gross Margin
- Sale per Square Foot
- Average Customer Spend
- Sell Through Rate
Management dashboard
A Real-Time Management dashboard helps you go through your store’s data sets, such as:
- Customer volume
- Employee records
- Employee-to-customer ratio
- Inventory
Availability of such factors on a single interactive platform gives you a better understanding of your store’s daily operations in a single look, in real-time, anytime, from anywhere
Benefits of Data Visualization in Retail Store Management

Store managers who can take initiatives to integrate data visualization in their management process, can be sure of sitting on heap of benefits. Be it creating effective loyalty programs for customers, or allotting the right sales person to a particular sales query, here are the top 4 benefits of using Data visualization as walking stick for your day-to-day store management.
1. One Touch Access to Understanding Trends
Be it getting hold of trends for that new toys that children fancy, or that new fashion garb that is making women gasp, trend forecasting and ad-buying data from multiple channels is delivered directly on your desktop or on your smartphones, in the easiest manner possible, to help you understand what’s causing a buzz. And that’s all thanks to Data visualization.
2. Understanding shifts in demand patterns
It’s a no brainer that festive season marks a rise in sales of ornaments and clothes. But what data visualization brings to this “no-brainer’ change of events, is the touch of knowing by how much amount will the demand will rise, along with marking the hot demographics for sales
3. Implementing better loyalty programs
A fact first! Customer loyalty programs strengthen customer loyalty. But what they also do is to provide you with lots and lot of customer data. What data Visualization does with this data is to provide you with more creative and intelligent ways to better understand your customers by providing all the important aspects and insights on a screen single screen. This lets you target promotions effectively and maximize return on your marketing and advertising investments.
4. Better Pricing Strategy
You don’t need any tool or device to let you know how to price products placed in your store. But what you need data visualization for when it comes to creating a better pricing strategy than your competitors, is to display all those confusing and large data in a more simplistic and user-friendly manner that may help you come-up with a better decision. Data visualization provides you with options like:
- Scatter chart
- Box plot
- Opportunity
It help you understand data with letting you to go through complex concepts of economics or statistics.
CONCLUSION

Data Visualization has arrived, offering clean and interactive dashboards that can be used to glean insights and gain business value. With easy to use and deploy BI tools, it is as friendly as it could ever be; if it wasn’t already. And with such an intuitive and interactive solution, you now hold the key to finding meaningful patterns in data to analyze the business and make decisions that are fact based, hence leading to a more empowered and efficient business model.
