
Data Visualization & Social Media Analytics

- Increasing social noise
- Unstructured data
- Getting social media metrics to right people
Make up for a huge chunk of challenges that you might face while running your social media campaign(s), or brand promotions.
But as soon as technology evolved to let us sneak into people’s screens, it simultaneously progressed too to let us know how well we are doing it. A progress known as social media analytics and visualization.
Why Social media Analytics? As per Search Business Analytics
Social media analytics is the practice of gathering data from social media websites and analyzing that data using social media analytics tools to make business decisions.
Nobody could have said it better. Simply put, you analyze the components of your social media web page, such as:
- Clicks
- Likes
- Shares
- Brand Mentions
- Profile Visits
- Active Followers
From understanding what smartphone features are in more demand among teenagers, to what the future of a movie yet to release holds? All such predications lie within our hands reach if we can utilize social media analytics to its full potential.
Now coming back to the definition we read above, there are three parts to it, them being:
- Data gathering
- Analysis
- Decision making.
The last part, decision making, is of the highest importance. Because that was the reason why we stepped in this fuss at first place. But before we make decisions, for the below objectives:
- Good ROI
- More followers
- Lesser spend on resources
Visualize Before You Decide
Once you have devised a much needed social media analysis strategy, which consists of these 7 steps:
- Setting your social media goals
- Defining your target market
- Conducting a SWOT analysis
- Analyzing your competitors
- Outline your company’s available resources
- Improving your website
- Performing social media audit
“Is the data, or the results obtained after each, or some, of these steps are easier to understand?” Because if they are not, then agin you have to depend upon a specialist or a “tech-guy”.
There is nothing wrong in it, but depending upon a third-party, or any other person for that sake, will only lengthen you chain of command. Means, your decisions will depend upon the understanding and knowledge of the person who you load with the responsibility of projecting those number to you. That’s why it becomes more important to visualize data in a way that not only is easily understandable, but is also arranged in a manner that helps you in finding co-relations and patterns among other variables too, with forcing you to depend upon anyone.
Benefits of Data Visualization in Social Media Analytics
While many of the advance data science techniques, such as Predictive and sentimental analysis, still need data scientists for implementation, BI(Business Intelligence) tools (Tableau, Power BI, Google Data Studio) have made it easier to deliver the power in the hands of non-tech guys. With the above mentioned BI tools, and many others like them, its now easier than ever to visualize your data in the way you want, from anywhere, at anytime. And here is what you start receiving once you switch to data visualization.

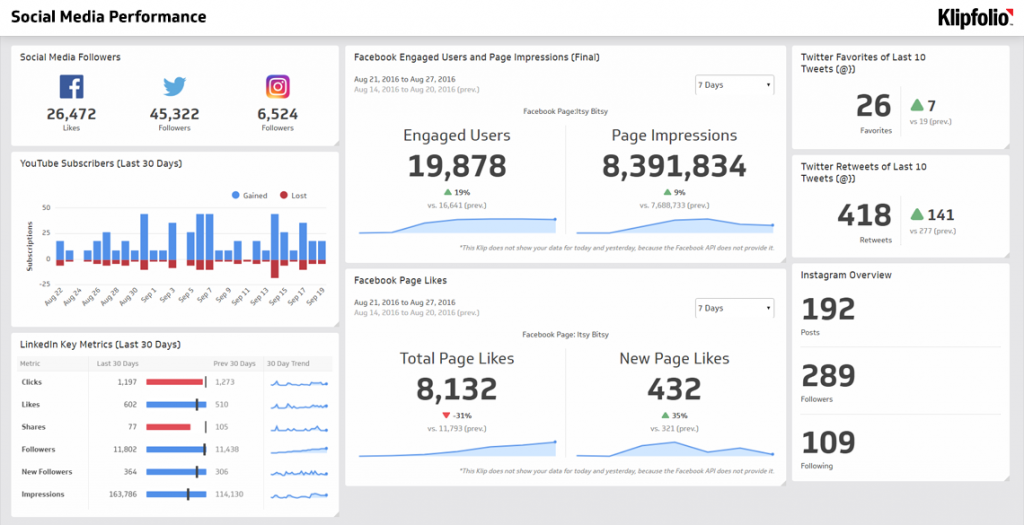
1. Hidden Patterns and co-relations
What’s the relation between weekends and visits on your social media page? What region of the country or city is interested in watching your videos? And what kind of Instagram #tag improve your post’s reach? While digital marketing your content you are always seeking patterns and trends in data to find opportunities. Raw data can give you the numbers, but when you plot the data, it becomes easier to spot patterns, correlations and developing trends in the inherent data.
2. Distill Complex numbers with ease
A picture worth a thousand words. And it’s more fun and easier to look at than a table full of rows and columns. But with visualization graphs and images, it’s far easier to arrive at conclusion than you ever could with excel sheets.
3. SEO Made Fun
SEO is not tough, but a complex creature. Keywords, anchor texts, back links, images, internal links, and then there blogs saying that there are about 200+ SEO factors to look at. So with so many factors to look at, we have to have a single-point-view that connects them all, while giving us a report on what factors performed well for us, and what didn’t. And SEO dashboards are just the thing for that.
4. Decide fast, Implement faster
Comparing between two or more options sometimes gives us headache. And when the completion is “that close”, reviewing the numbers again and again doesn’t help or close. But it looks like companies were attentive to our such problems, so not only they developed tools that make comparison easier, but also fun to work with. Like this one, developed by Google.
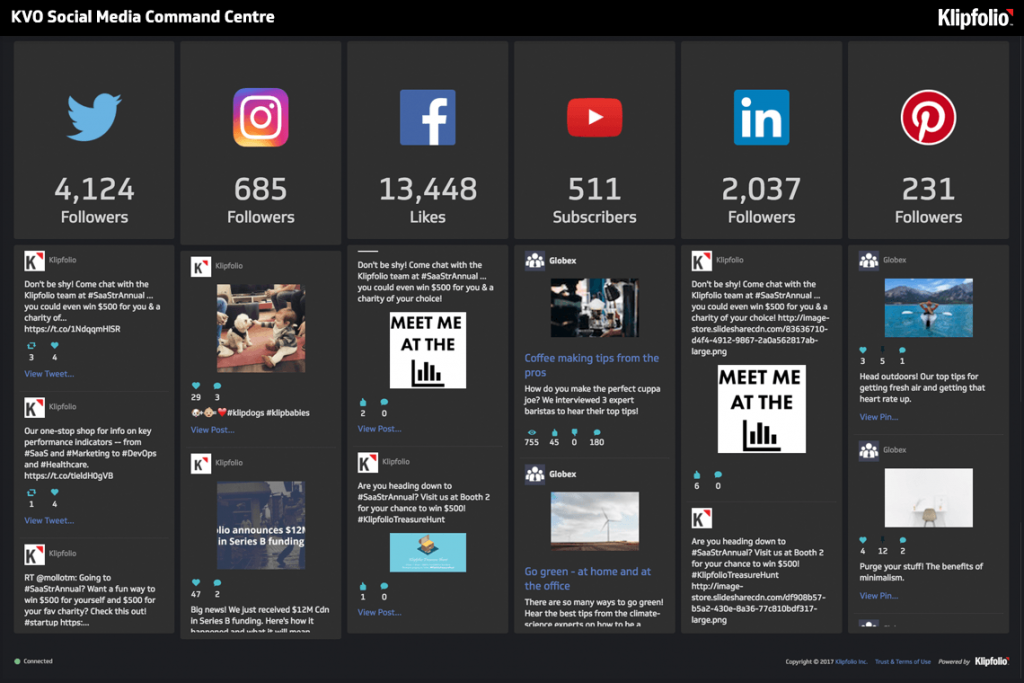
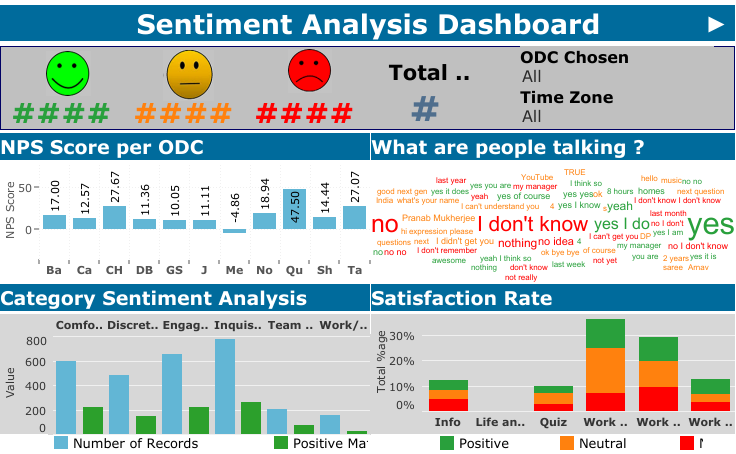
5. Understand the Noise
With your comment section open to the world, it becomes very “noisier” to read and understand what the public is talking about. And you simply can’t go through all the garbage written on your walls. But with data visualization dashboards, you can develop a system of your own that will display only the words and types of comments that you wish to go through, helping you to get a better understanding of people’s sentiments. The comments can be further categorized as positive, negative, and neutral.
Summing it Up
With the kind of traffic the world web is experiencing, and the options today’s customers have, the need to analyze and decided in real-time is now more than ever. While the big enterprises have known this for decades, leading them to setting up devoted department for the process, BI tools are now making it easier than ever to let the mid-level and low-level marketers in understanding the flow and moods of potential customers too. And it’s only about time that you catch-up, since neither your competitors, nor your customers will wait for you to do so.