Power-Up Your Data With Microsoft’s Power BI
Old, But Not Gold
Challenges with conventional data visualizations methods
Companies and decision makers have long been relying on the inefficient and sluggish “Report Factory” models to seek answers for their daily operations. The major problem of this kind of reporting making model is the fact that you have to rely on IT team(s) to provide the final solution, consisting of these three steps:
- producing a report,
- reviewing the report, and then
- coming to a conclusion,
and finally hope the data is still relevant, given their redundancy due to lack of real time data capturing and analysis.
Other than being redundant and inefficient at the same time, what makes this kind of reporting not preferable in modern times is the fact that you don’t get to decide directly, and intuitively, the key factors upon which reporting and analysis should be done.
Covered with dull, inactive , and cluttered tables, histograms, scatter plot, line, and bar charts, such reports barely give insights to those who are not ‘that’ good with numbers and stats. Thus again making those with good grasp upon statistics, called “tech-guys” to decode and deliver the insights to those who need to make decisions, called “non-tech guys”; hence seizing a direct line between insights and decision makers.
And that’s the problem that this modern BI (business intelligence) tool, Microsoft Power BI, has chosen to address and solve. By delivering the power of data collection, transformation, and analysis directly in the hands of decision makers, Power BI helps companies and departments in making decisions backed by accurate data, rather than the insights analyzed and delivered by a third party .
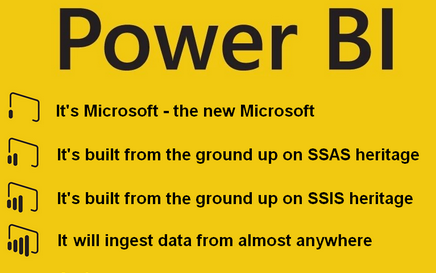
What is Power BI?

Power BI is a cloud-based business analytics service, developed by Microsoft, which enables users, even those who are not that friendly with technology, to visualize and analyze data, along with the functionality of creating real-time dashboards, with speed, efficiency, and understanding.
Not only Power BI lets you visualize your data and share insights across your organization, it helps you in embedding your organization’s data in your app or website.
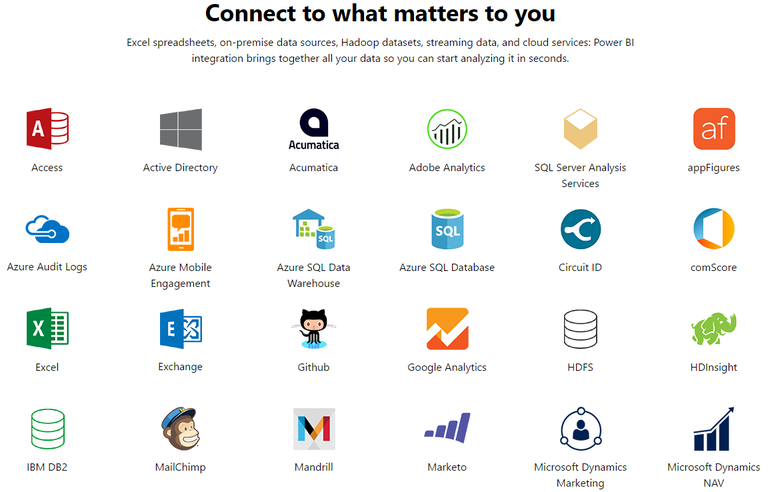
Power BI joins all your data from disparate systems (including SharePoint, Google Analytics, Azure, Marketo, Facebook, Quickbooks, and much more) into a centralized home for your data. This allows everyone in your organization to focus on metrics important to them.
Key Features of Power BI
When it comes to deciding what tool to choose for preparing data visualization for your organization’s big data, Power BI proves to be the right platform. For it comes with plethora of features that will suit and fulfill all your data visualization needs “Anytime, Anywhere”. Following are features that make Power BI an interesting and easy product to work with:
1. Natural Language Q&A
One of the most powerful feature of Power BI, Q&A lets you explore your data using intuitive, natural language(English) capabilities and receive answers in the form of charts and graphs.
For example, “What were total sales last year?”, would help you uncover the answer in forms of charts and figures, without making you to type commands or extra coding.
2. Dashboard Printing
Power BI lets you print an entire dashboard, a dashboard tile, a report page, or a report visual from Power BI service which can be handy in board meetings and discussions.
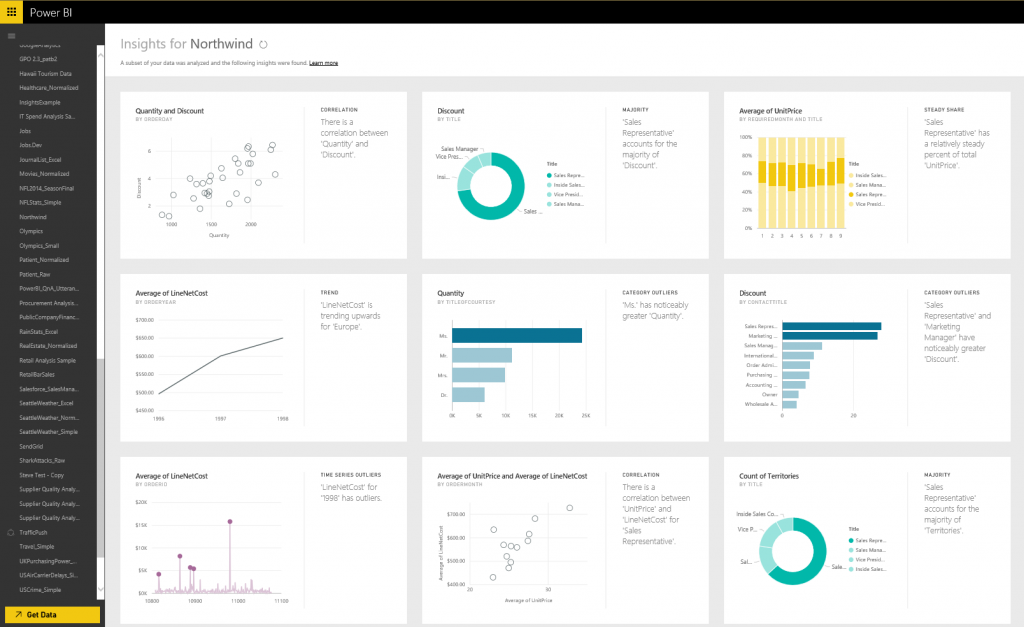
3. Automatically search data sets for hidden insights
If you have a new data set and you don’t really know where to start, then the “Quick insight” feature of Power BI will generate for you interesting interactive visualizations based on your data. Quick insights can be run on an entire data set (quick insights) or on a specific dashboard tile (scoped insights).
4. Custom Visualizations
Created by developers, using the custom visuals SDK, there are many different types of pre-packaged visuals available for you to use, when creating or editing a Power BI report.
5. Easy integration with other Microsoft products
Power BI has been engineered so it can be easily used with Excel, Office 365, Azure, and SQL Server. If you have been using MS-Excel, you will find using Power BI much easier as both can be used together with much ease.
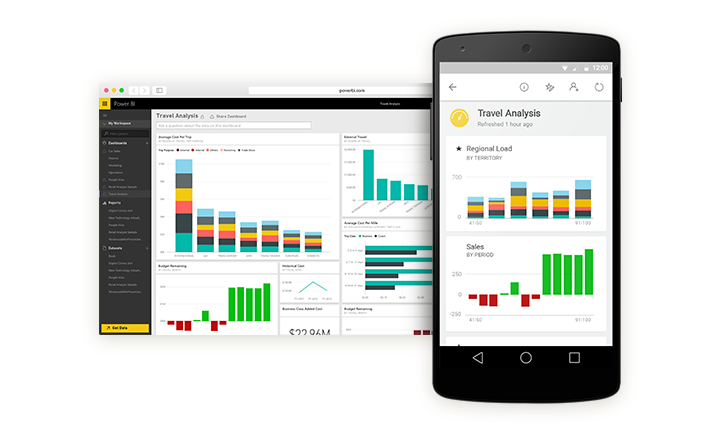
6. Power BI Mobile
BI mobile enables you to view your reports in real-time on your tablets or smartphones. This ensures you are always connected to the data that matters to you.
Benefits of Power BI
If your business is still using spreadsheets, email, and database files to share data, then Power BI is for you. Once your organization comes on board with Power BI, all your employees, ranging from lower to the top-most level, will start experiencing all of these mentioned benefits:
1. Intuitive and insightful
Power BI’s drag-and-drop UX lets you quickly find the insights you need and visualize them. Employees at every level can now:
- Identify trends
- Maximize profitability
- Make smarter decisions
- Pick out business opportunities easier
2. Unlimited access to on-premise and in-cloud data
Whether your data resides in a cloud service such as Marketo or Salesforce, or on-premises, Power BI collects and stores all your on-premise and cloud information in single, more centralized location that you can access whenever and wherever as required. Enabling you to connect, clean, shape, model, and visualize it with live reports and dashboards.
3. Immediate and fruitful collaboration
Even if you are an executive, or manager, with little to no knowledge of data science, still you could share dashboards and reports with the right people wherever you go. Power BI system also provides you with the flexibility as it operates compatibly with the leading operating systems – Windows, iOS, and Android. Custom alerts will notify you about any updates or changes in your data so you can immediately work with your team to take immediate action.
4. Connect with Anything and everything
Power BI’s developers ensured their system can blend into any software ecosystem, and the proof for that are the numerous connections to popular third-party software and Microsoft tools.
5. Ad-hoc reporting
Ad hoc analysis is a process with which allow you to create a report that does not already exist, or drill deeper into a static report to get details about accounts, transactions or records, without taking help of third-party developers. Power BI supports Ad-hoc Reporting.