Data Visualization and Healthcare: A Union to Opt For

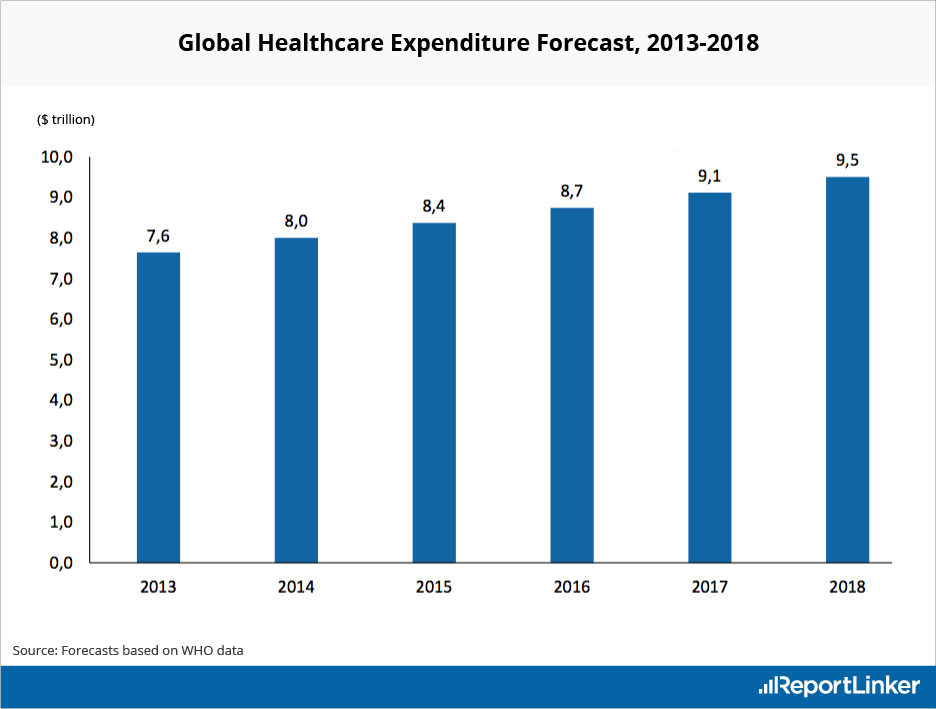
Forecaster to be an industry worth $ 9.5 trillion, by WHO, there are still some major challenges that continue to ail health care facilities across the globe. The major ones are:
- Financial Challenges
- Adapting to regulatory standards
- Catering to patients satisfaction
- Staffing and scheduling
- Training Per Department
But these challenges have always been there, only getting better and complex with time as demands and nature of the business changed.
With rapid expansion of accessible and consumable data, we’re looking at 2.5 quintillion bytes per day. And if not handled properly, it will only amount to another challenge.
But what if the very reason that’s leading up to such challenges, i.e. Technological disruption, can be used as a solution to help healthcare facilities to come up with better and smarter ways to run their spaces?
And what if I told you that the answer has already arrived?
Visualizing Solutions: Data Visualization in Healthcare

For a long time now healthcare facilities and personnel have depended upon slow, inefficient “Report Factory” models to seek answers for their daily operations. This system makes them wait for IT team(s) to provide the final solution consisting of these three steps:
- Producing a report
- Reviewing the report
- Coming to a conclusion
Finally hope the data is still relevant, given their redundancy due to lack of real time data capturing and analysis.
Conventional visualization methods like such require significant processing time, which limits the rate and quality of analysis. But modern Interactive visualization systems, created by BI tools like Google Data Studio, Power BI, etc., maintain a closed loop between the user and the system and, thus, are efficient and fast.
With smart, simple, and efficient Data visualization solutions like:
- Management Dashboards
- KPI dashboards
- Interactive Audit Reports
Expected outcomes include:
- Improved response times
- Improved patient flow modeling and management,
- Enhanced reporting capabilities
- Better support for clinical costing, and
- Improved resource coordination.
While on one hand KPI dashboards help the facility managers in monitoring performance indicators in real time, interactive audit reports help in delivering key insights based entirely on proven data, rather than gut feeling.
Solutions That Deliver: BI in Hospitals
Business Intelligence, or (BI), is a set of techniques and tools employed for the acquisition and transformation of raw data into meaningful and useful information for business analysis.
And with modern BI tools like Power BI , Tableau, Google Data Studio, etc., it’s now easier than ever to collect, transform, and analyze big data that is produced by your store(s).
The key solutions that these BI tools provide when it comes to data visualization are:
KPI dashboard

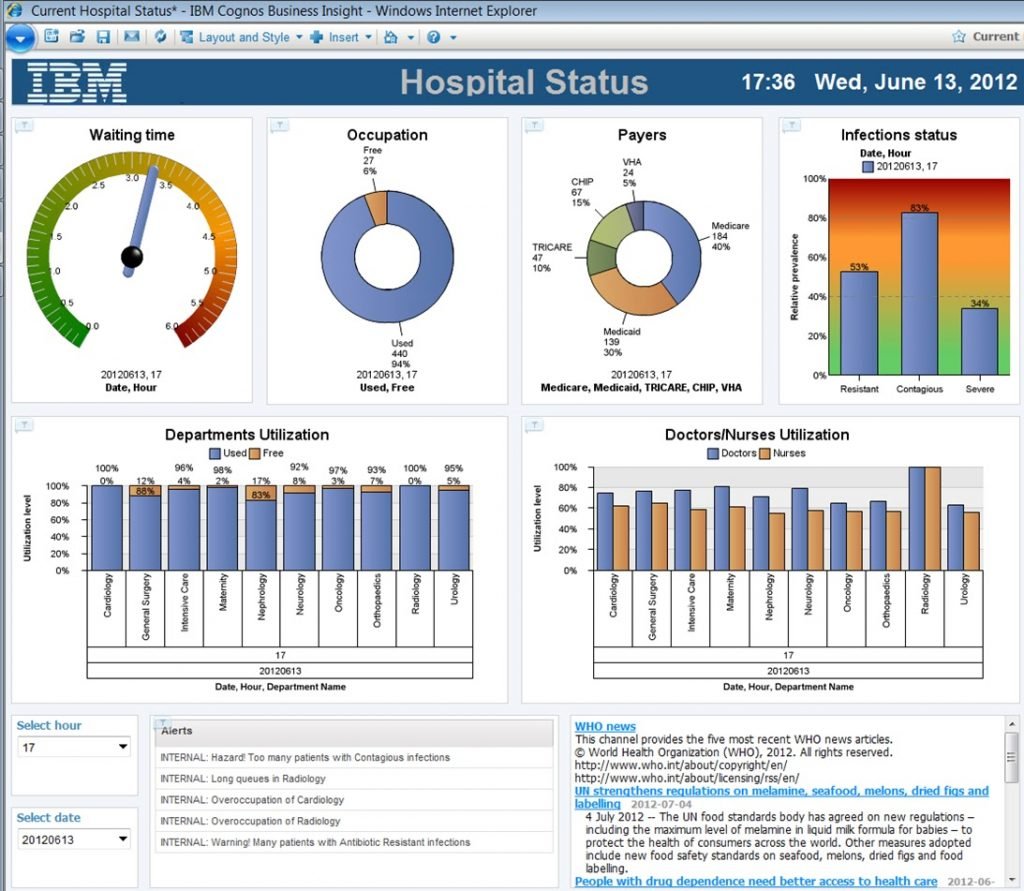
A medical KPI (Key Performance Indicator) dashboard is an easily readable and graphical display of the key performance indicators that a hospital team could need to monitor measures of financial performance, quality of care, and clinical governance.
A typical KPI dashboards includes all the necessary factors that one could need to lead clinical management at its best. Some of the many performance indicators are that can be easily monitored with a KPI dashboard, in real-time are :
- No. of Outlier
- Outlier Percentage
- Stays per patient
- Patient Wait Time
- Staff-To-Patient Ratio
- Claims Denial Rate
Management dashboard
A hospital management dashboard helps you keep track of all your organizational management activities, such as:
- Medical Stays
- Patient records
- Patient ticketing system
- Medicinal purchases
- Revenues & purchases
- Patient satisfaction
Benefits of Data Visualization in healthcare

Hospitals and clinics that can take initiatives to integrate data visualization in their management process, can be sure of sitting on heap of benefits. Be it scheduling appointments for patients or allotting duties to the right team of personnel, here are the top 4 benefits of using Data visualization as walking stick for clinical decision making.
1. One Touch Access to Patient’s medical history
It not an easy thing to keep and produce a patient’s medical history at the when it’s needed. And it’s a no brainer that how much clinical history is needed while treating cases of small or big health conditions. But with visualization dashboard(s), hospitals could collaborate on a single network and could have the patient’s entire medical record at their fingertips with the click of a button. This means having entire documented medical history in front of them.
2. Improved response time
Ask any medical officer leading a big healthcare facility what’s their top concern in rush time is, and in a unison they will speak up one, and one word alone, “Response time”. Time is of utmost value when it comes to running and managing healthcare facilities. Be it a season of flu outbreak, or a day of wild fire, every second counts. Emergency call-out providers could improve ambulance service response times by mapping out where the higher number of calls are coming from in such conditions, and stationing their ambulances or first-aid facilities closer to these areas, thus cutting down on their time to get to the patients
3. Real- Time monitoring
Emergency or not, hospitals are always “Rush-hours”. And with ever changing parameters, it’s never an easy job for facility managers to come up with accurate and instant solutions. But with the entire staff on one platform, delivering their data and insights in real time, coming with dynamic decisions becomes easier, as real time monitoring & management dashboard provides and displays all the required metrics as they happen.
4. Programming Appointments
This one is the top most concern for health care teams around the world. Giving appointment timings that are suitable for both patients and the doctors is always something that plays a vital role in proper healing of patients. But with regular monitoring of patients health conditions by their wearables, like smartwatches and smart bands, and receiving their inputs directly on dashboards, it would be easier for hospitals and clinics to know the exact time a patient could need a certain kind of health examination.
CONCLUSION

Data Visualization has arrived. And with easy-to-use and deploy BI tools, it is as friendly as it could ever be; if it wasn’t already. And with such an intuitive and interactive solution, the medical managers, stakeholders, and policy makers now hold the key to finding meaningful patterns in data to analyze their organization, and make decisions that are fact based, hence leading to a more empowered and efficient business model.
