Service

Data Visualization

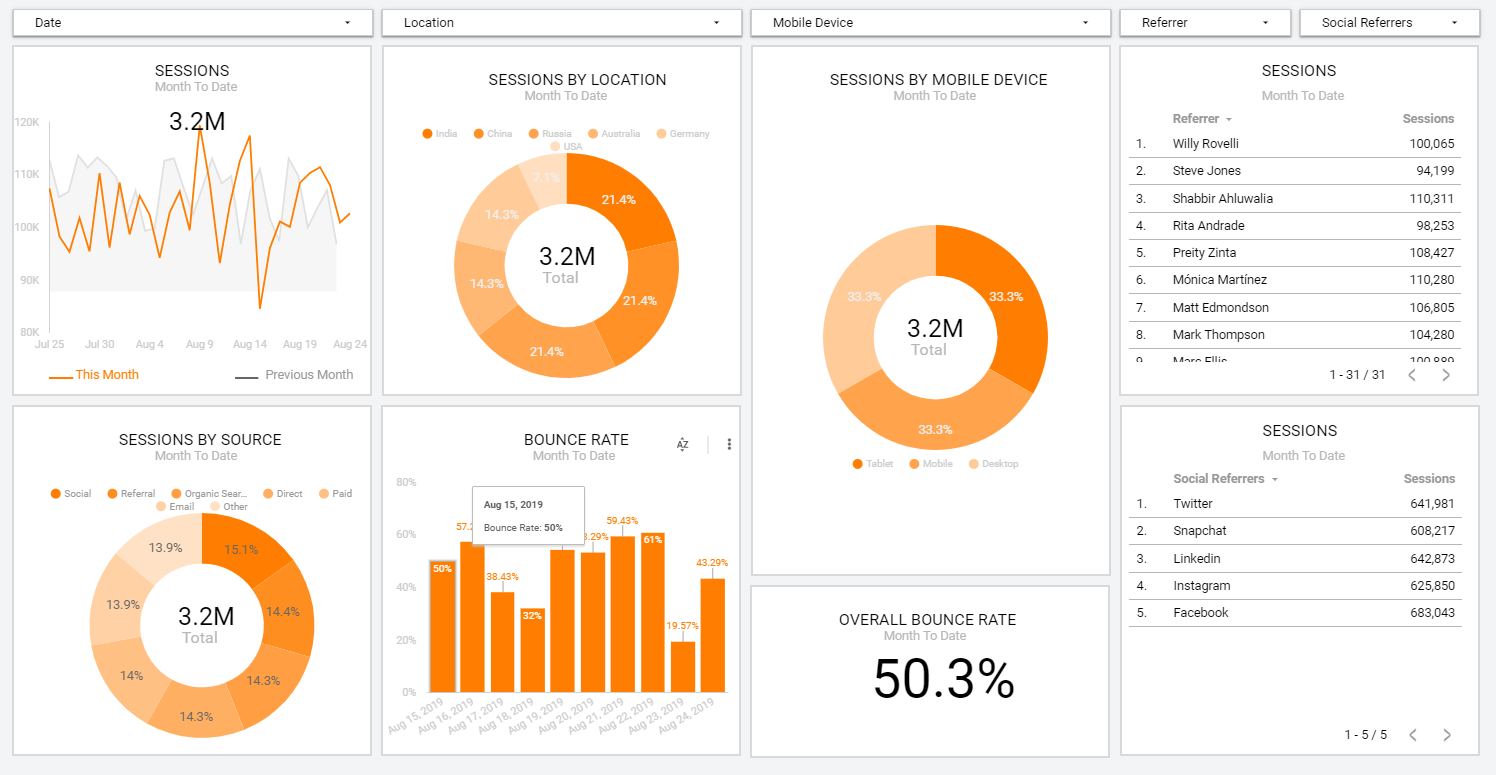
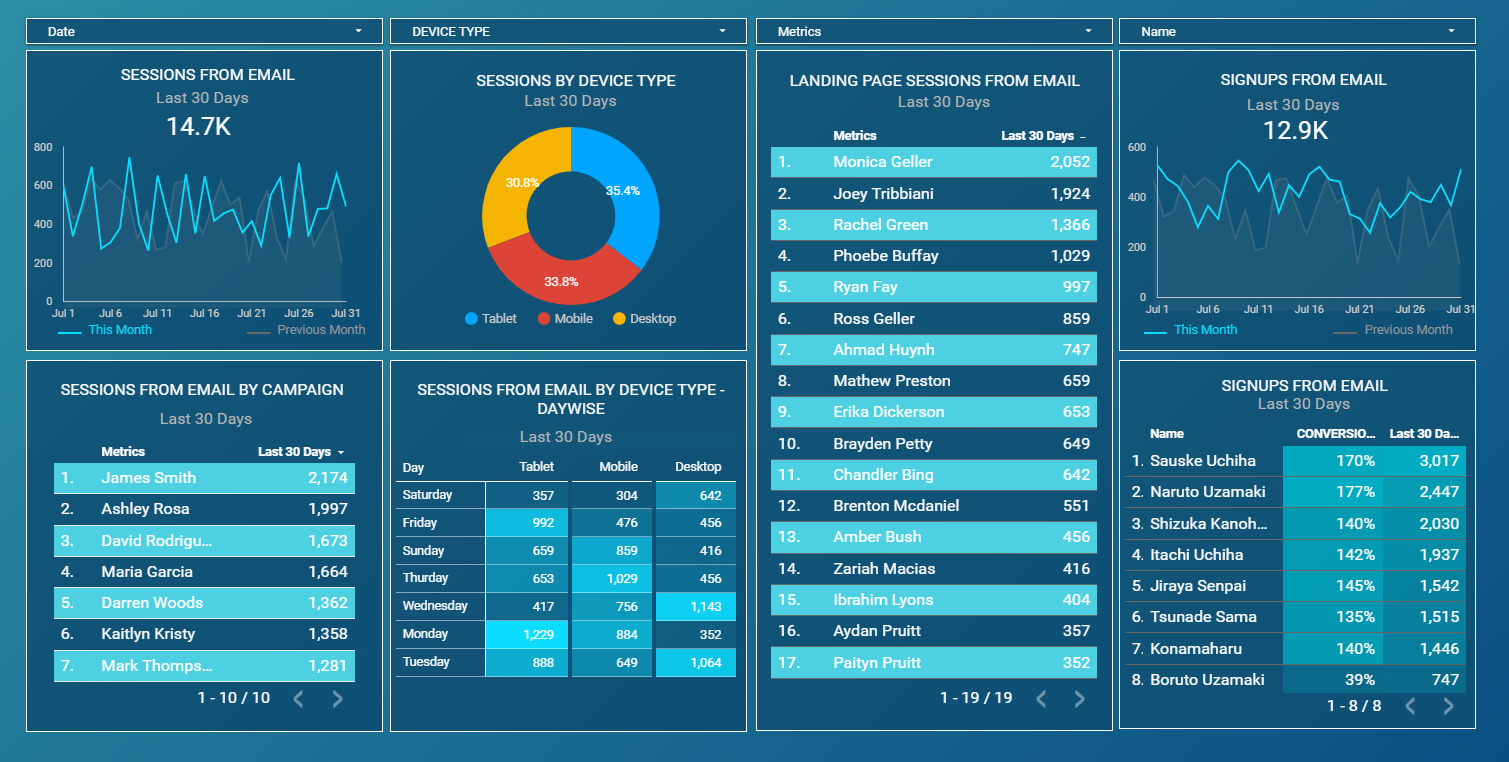
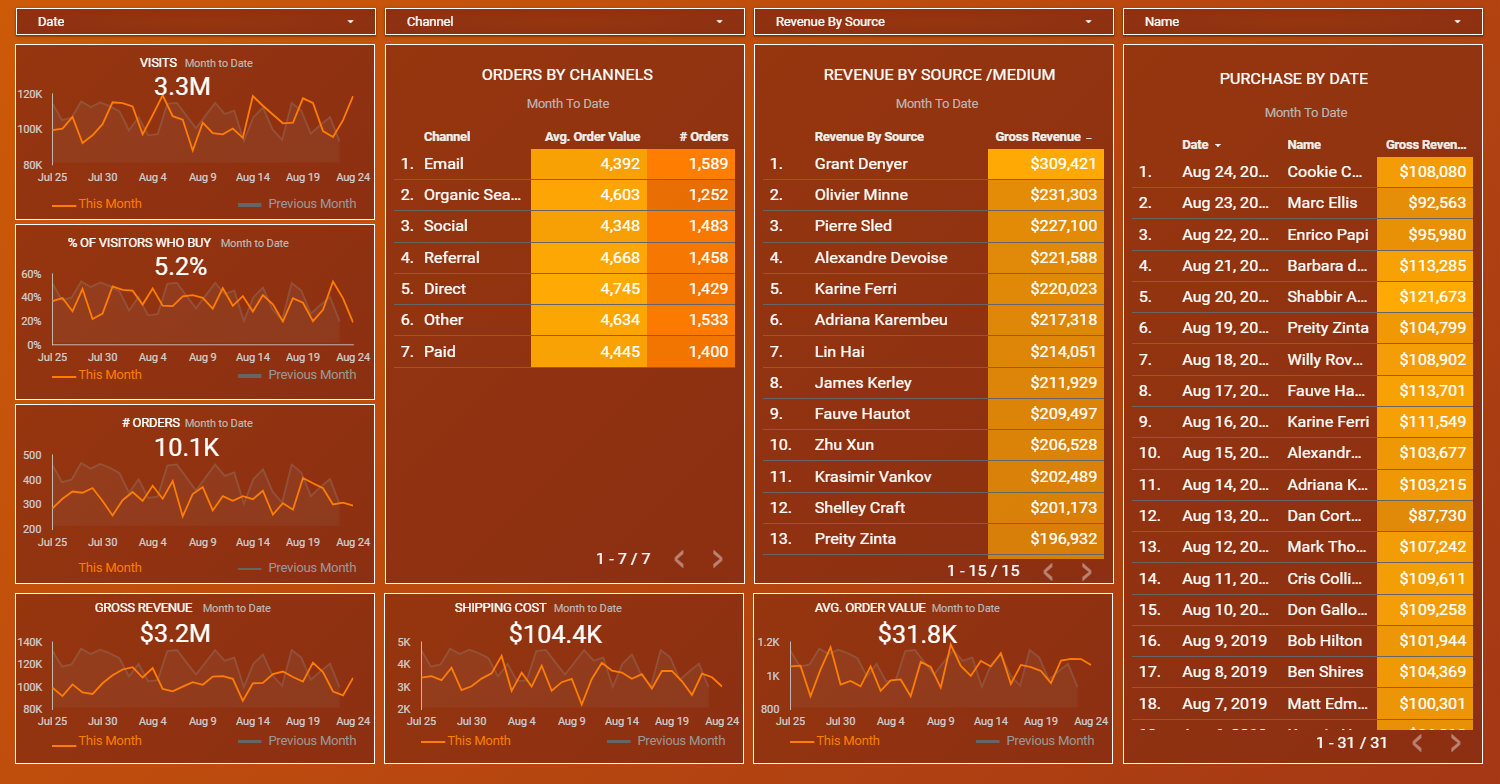
In this competitive world with an enormous amount of data, it’s nearly impossible that we get a complete insight into the data. Data that companies generate is not even humongous but also diverse that makes it even more complicated to understand, but here the team of IDeepeners has a great skill set in handling big data and make that opaque data, crystal clear in the form of KPIs, metrics, patterns, trends, and charts in real-time dashboards. So you can get an absolute lucid report.
img
Interactive BI Dashboards

In IDeepeners, we provide an interactive BI that not only provides reports and dashboards but that all are real-time that make them highly intractable with the users and even you can customize them according to your needs.

Mobile Friendly

The dashboards that we provide in iDeepeners are absolutely friendly with your mobile phone and even provide you overall reciprocity, which makes this even more convenient to interact with.

Reports Based on Business Role

Here in IDeepeners, we provide individual reports as per your business roles and even the data you receive is a subdivision of the overall companies’ data in easy words the role-based reports are generated.

Easy Interpretation of Complex Data

As the data you provide to us is highly complex but with the help of our skill full team and highly professional tools we will manipulate the data into easily understandable visual reports.

Reduced Dependency on Spreadsheets

With the help of BI reports generators and dashboards craters the wholesome set of your spreadsheets and data that is humongous in size will no longer usable that it use to be.

Hassle free Filtering of Data

Customers don’t have to figure out how to filter the data, as IDeepeners provide a hassle free technique for the data filtration in which the algorithms work for you and provide a solution for it.

BI Dashboards

View some of our live dashboard for example of actionable BI Dashboard Reports

1
Requirement gathering & business understanding
It is an initial process which will identify what services that all you need, this process needs a whole bunch of questionnaire session with the help of which we can analyze your needs.
2
Data Collection
It is most important in the whole set of processes that all we do, it includes a collection of data from various sources, which all are needed for the deployment of the reports.
3
KPIs & Metrics Development
We provides the key performance indicator of the company in different fields that the company is serving for-profit creation in a competitive market.
4
BI Dashboards & Reports
It is the final process in which we have to deliver the virtual reports that we have generated and implement them into your system and train your employees for brief real-time usage.
img

Need Data Visualization Services?

Our proficient team is ready to deliver a solution that suits our customer’s needs best. Not sure where to start? Contact us for a free consultation.

Send us Message

Let’s get the conversation started

Message sent!